Feeding the fire: Tracing the mass-loading of hot galactic outflows with O VI absorption
Gas within galactic outflows spans a large range of temperatures. For instance, observations show that the local starburst, M82, has outflowing molecular gas and hot X-ray emitting plasma, as well as warm photoionized gas. Further, previous observations suggest that gas can transfer between the different phases, implying that the outflowing mass is shifting phase structure at different times, locations and velocities. This changing phase structure makes it is very hard to quantify the total amount of gas that galactic outflows remove from galaxies.
As part of a recent paper, I used MEGASAURA spectra of a gravitationally lensed galaxy to quantify gas in two very distinct temperature ranges: warm photoionized gas and O VI (which traces gas transitioning between photoionized gas and hotter gas). The relationship between the two phases is surprising, and it may change how we picture galactic outflows.
As part of a recent paper, I used MEGASAURA spectra of a gravitationally lensed galaxy to quantify gas in two very distinct temperature ranges: warm photoionized gas and O VI (which traces gas transitioning between photoionized gas and hotter gas). The relationship between the two phases is surprising, and it may change how we picture galactic outflows.
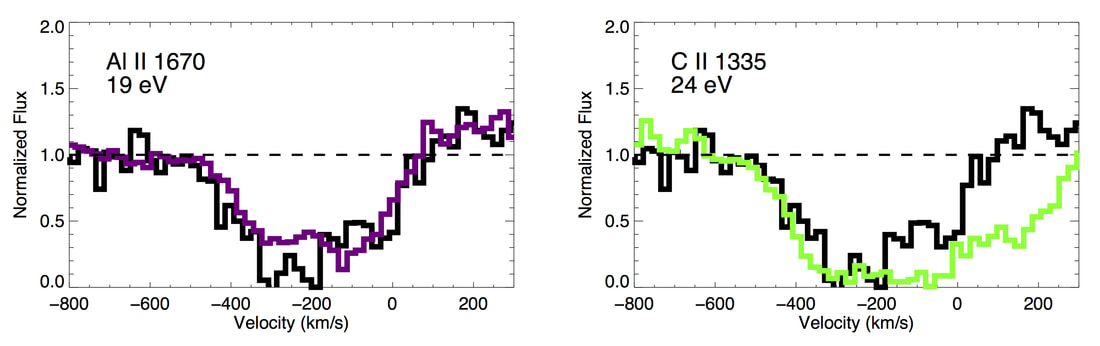
Two example MEGASAURA absorption lines. On the left the O VI line (in black) is compared to the Al II 1670 line (purple), while on the right the C II 1335 line (green) is compared to the O VI line (black). The Al II line is weaker than the C II line because it never reaches 0 at any portion of the profile. The O VI closely follows the weak line redward of -200 km/s, while the O VI looks very similar to the C II line blueward of -200 km/s.
|
The O VI line profile has two regimesWhen I compared the O VI absorption profile to low-ionization lines, I found that the hotter gas closely follows the low-ionization gas (see the image to the left). However, the O VI has two different regimes: the depth of the O VI line follows weak optically thin lines at low-velocities, and strong saturated lines at high-velocities. This transition happens at -200km/s for all lines. This implies that the O VI line strengthens as the velocity increases, and becomes saturated bluewards of -200 km/s.
|
O VI is created as Si IV is destroyedWhen I compared the column densities of the O VI and Si IV gas, I found that the O VI column density rises blueward of -200 km/s while the Si IV column density falls. The increasing column density explains why O VI becomes saturated beyond -200 km/s. This implies that O VI is created as the Si IV is destroyed.
This also suggests that the transitional and cool gas are distinct from each other. In fact, I showed that the ionization structure of cool gas is well described by photoionization models, but these models do not describe the O VI at all. Rather, the O VI is best described by models for a conductive interface between the photoionized gas and a hotter, unprobed, outflow. |
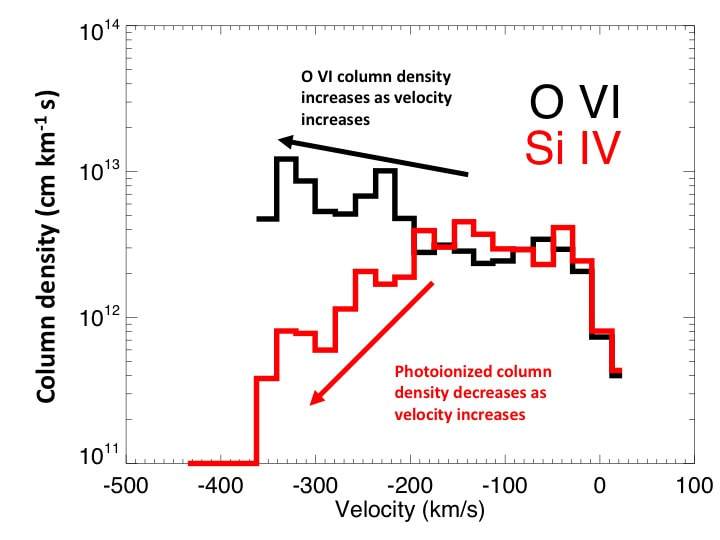
Comparison of the O VI column density (black) and the Si IV column density (red) at specific velocities. After -200 km/s, the O VI column density increases as the velocity increases, while the Si IV column density decreases. This implies that OVI is created while Si IV is destroyed.
|
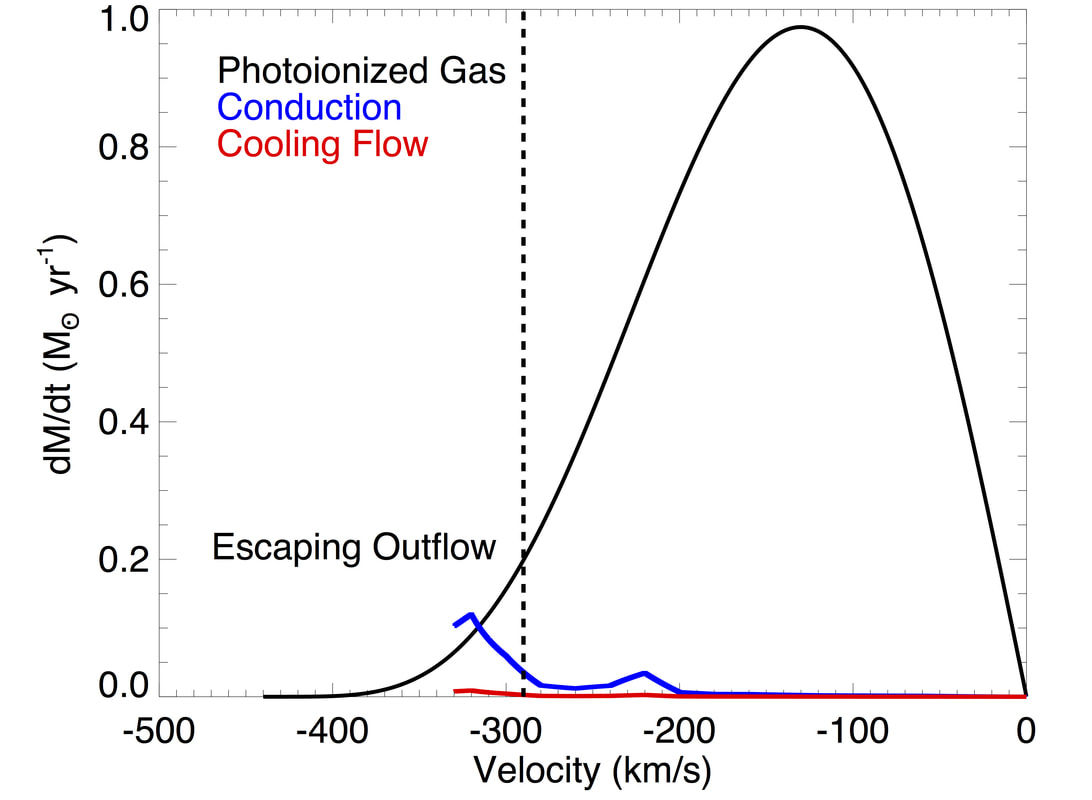
The mass outflow rate at a given velocity for the photoionized (black) and the transitional gas in a conductive interface (blue). At low-velocities the photoionized gas is more massive than the hot outlow, but at high-velocities the hotter gas dominates the mass outflow rate. Most of the gas traveling faster than the escape velocity (dashed line) is in a hotter outflow phase.
|
Most of the high-velocity outflowing gas is at high temperaturesFinally I calculated how much mass outflows in each temperature phase have at each velocity (image to the left). I found that the photoionized gas is much more massive at low velocities than the transitional phase. However, at high-velocities the mass of the transitional gas quickly rises. At the highest observed velocities the transitional mass outflow rate is more massive than the photoionized outflow.
This is important because most of the mass that travels fast enough to escape the galaxy is in a hot phase that is rarely observed. This may indicate that our knowledge of how much gas actually escapes galaxies is uncertain, and we need new observations to study this. |
Absorption lines probe gas that is mass-loaded into a hotter windFinally I presented a physical picture that attempts to explain these observations. Initially a photoionized cloud is at rest within the galaxy, but then supernovae create a hot wind that propagates out of the galaxy (see the left panel of the figure on the right).
This blast-wave encounters the photoionized gas and accelerates the cloud out of the galaxy through ram-pressure. Conduction transfers heat from the hot wind to the photoionized cloud, which evaporates the gas out of the photoionized cloud and into the hot wind. This process is called "mass-loading" because the mass of the hot wind is increased by adding cooler gas. These may be some of the first observational evidence that the gas we typically observed in outflows is mass-loading a hot wind. |
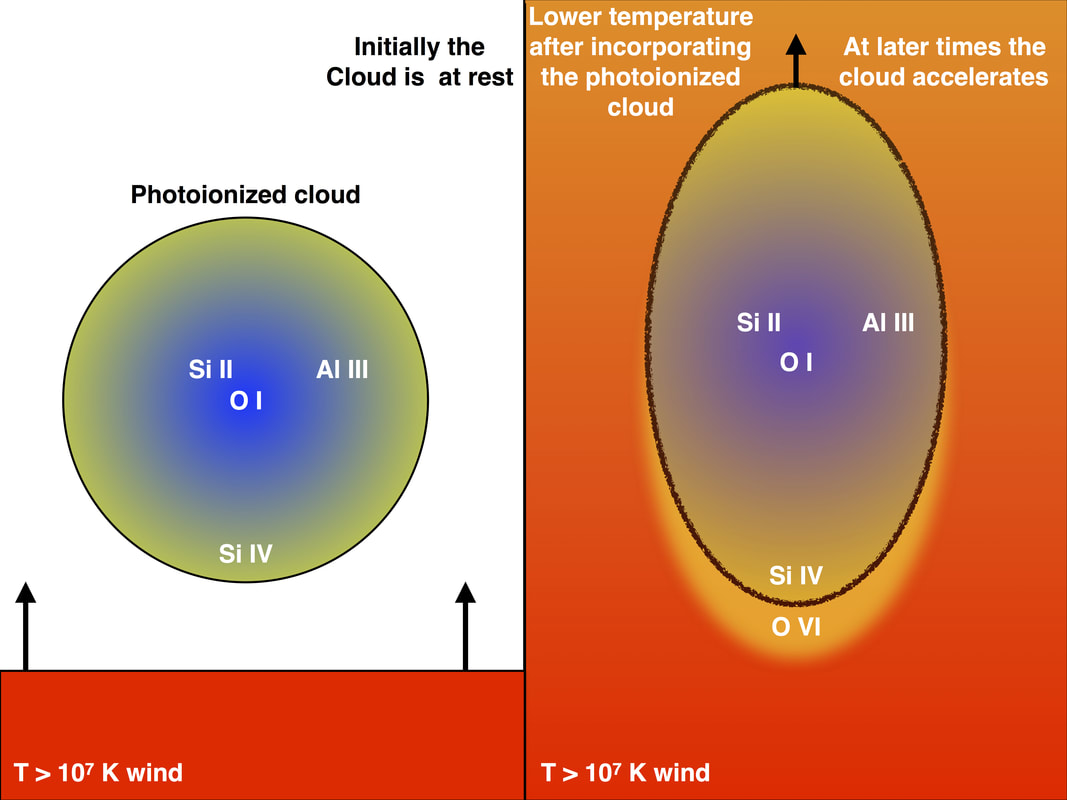
The physical picture that I presented attempting to explain our observations. On the left I showed the initial conditions where a photoionized cloud is at rest and about to interact with a hot wind. The locations of various observed ions are shown, but there is initially no O VI. On the right shows the cloud as it is interacts with the hot wind. The cloud accelerates, and some of the photoionized gas is evaporated off the cloud and heated to high temperatures. This evaporation of the photoionized cloud causes the Si IV column density to decline. This gas briefly has a temperature equal to the O VI phase, and this is why we observe the O VI column density increasing as the Si IV column density decreases.
|