The Different temperatures of Galactic outflows
I extended the previous analysis to 3 other transitions: O I, Si III, and Si IV. Including Si II, these four transitions probe gas at different ionization phases (between 13.6 and 45 eV), and can be used to determine the ionization structure of the outflows.
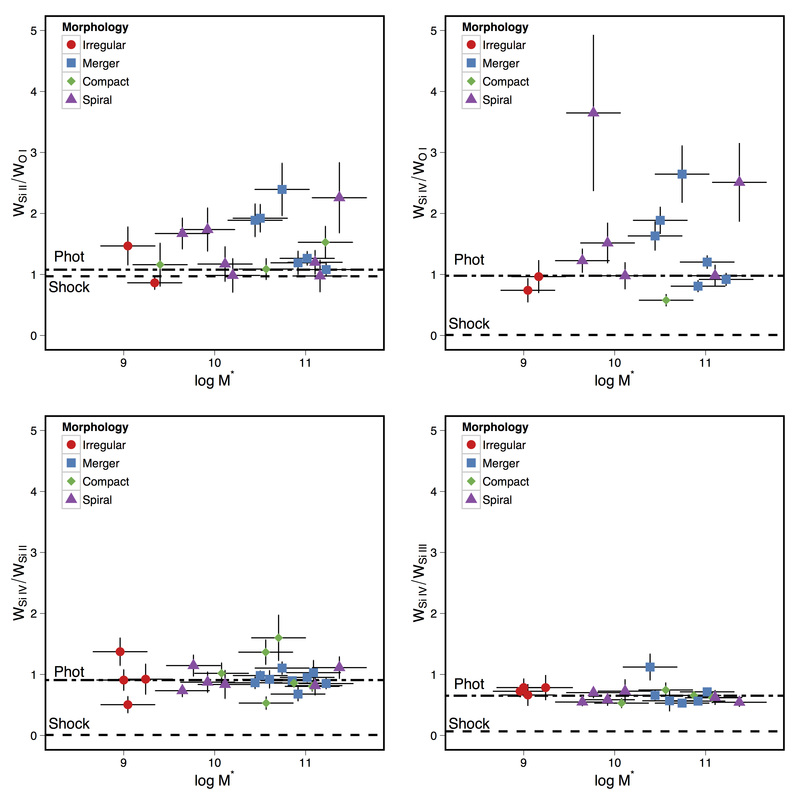
I first studied how the strength of the lines scaled with stellar mass. I then determined what drives the shallow scaling of the equivalent width with stellar mass. Finally I studied which mechanisms could create the observed Si IV/Si III, and Si IV/Si II ratios.
The paper can be found here.
I first studied how the strength of the lines scaled with stellar mass. I then determined what drives the shallow scaling of the equivalent width with stellar mass. Finally I studied which mechanisms could create the observed Si IV/Si III, and Si IV/Si II ratios.
The paper can be found here.
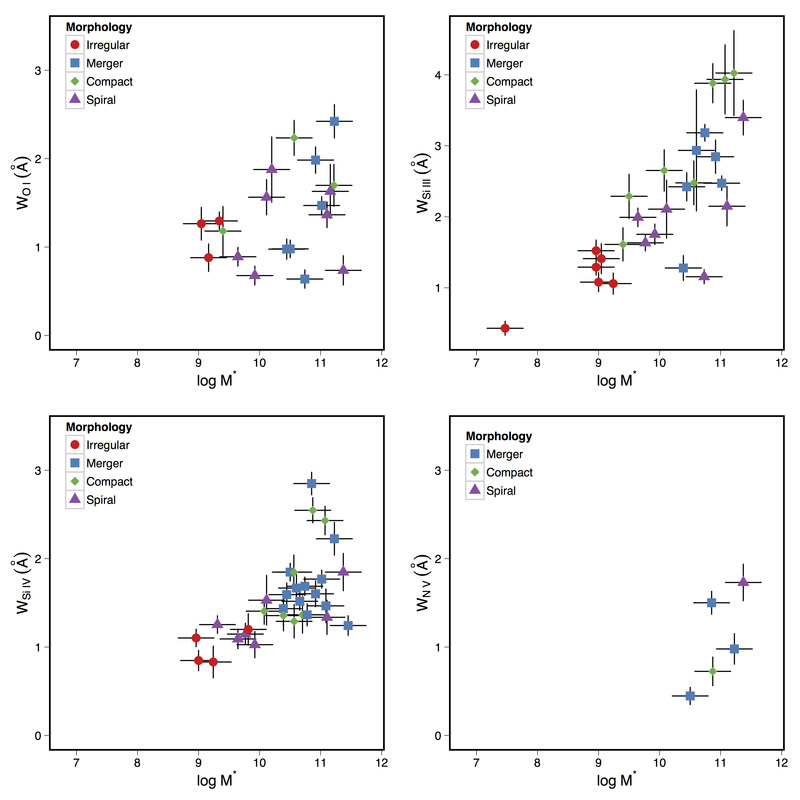
Four plots of the scaling of the equivalent width with the galactic stellar mass. The four transitions, from left to right, top to bottom are O I 1302, Si III 1206, Si IV 1393, and N V 1238. There is a strong, yet shallow, correlation between equivalent width and stellar mass for the Si III and Si IV transitions.
|
|
What drives the equivalent width scaling?There is a lot of information encoded within the equivalent width: large equivalent widths correspond to large optical depths, line widths, covering fractions, or some combination of all three. To break this triple degeneracy I made measurements of the three quantities from the Si IV doublet (figure to the right). The top left panel corresponds to the covering fraction, and has a nearly constant value at 0.82. The top right panel corresponds to the optical depth, which also has a constant value. The bottom left panel shows how the line width scales with stellar mass.
|
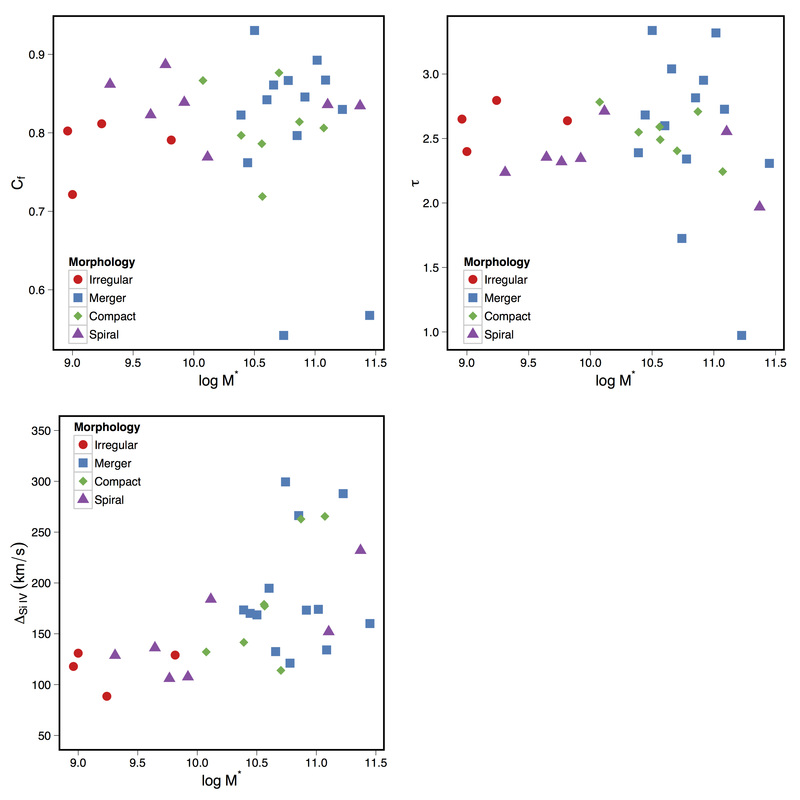
Plot of the three components that contribute to equivalent widths: Covering Fraction (top left), optical depth (top right), and line width (bottom left).
|
|
|